Color_r
论文配色参考
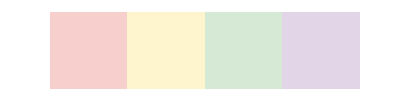
- 采用淡雅柔和色块,整体明度高,减少视觉疲劳。
- #F7CFCD - 247,207,205
- #FEF4CE - 254,244,206
- #D6E9D4 - 214,233,212
- #E2D5E7 - 226,213,231
- 主要为蓝紫色系,整体色彩搭配适合用于营造冷静、专业且富有层次感的视觉环境。
- #9594C0 - 149,148,192
- #6665A5 - 102,101,165
- #30569F - 48,86,159
- #4968A9 - 73,104,169
- #4585BE - 69,133,190
- #10B4DD - 16,180,221
- #81C8E4 - 129,200,228
- #6AC2D2 - 106,194,210
- #BFDEE5 - 191,222,229

- 暗色调带来稳重感,浅淡柔和色则增添了些明快与温馨,适用于营造既有深度又不失舒适感的视觉氛围。
- #963634 - 150,54,52
- #D35400 - 211,84,0
- #F5E0E0 - 245,224,224
- #DACDE6 - 194,189,150
- #3E68A6 - 60,104,166
- #1E78B5 - 30,120,181
- #E0E7F3 - 224,231,243
- #7F7F7F - 127,127,127

- 涵盖了从沉稳到淡雅的多种色调,简约、平和且不失格调。
- #C0908C - 192,144,140
- #2E4971 - 46,73,113
- #848E9F - 132,142,159
- #FCF8ED - 252,248,237
- #D9EEF0 - 217,238,240
- #F9EFF7 - 249,239,247

- 兼具深度与柔和感,既神秘又清新。
- #A35C72 - 163,92,114
- #3C779F - 60,119,159
- #86D2B2 - 134,210,178
- #A08EA0 - 160,142,160
- #F1E4E8 - 241,228,232
- #E1E8F1 - 225,232,241
- #CAE4D8 - 202,228,226
- #A0B3BC - 160,179,188

- 主要为绿色系及其相近色调,适合营造自然、清新且富有层次感的视觉效果。
- #D7E065 - 215,224,101
- #BAB063 - 186,176,99
- #A4BA7E - 164,186,126
- #659A6F - 101,154,111
- #46A6A1 - 70,166,161

- 涵盖了从冷到暖、从深到浅的多种色调,整体色彩组合丰富多样,适用于打造风格多变的视觉效果。
- #7bbdd3 - 123,189,211
- #afd1dd - 175,209,221
- #dce9ef - 220,233,239
- #c9b8e5 - 201,184,229
- #dbd5ef - 219,213,239
- #a50000 - 165,0,0
- #d16694 - 209,102,148
- #f4d1e9 - 244,209,233
- #fce8f4 - 252,232,244
- #eddbd9 - 237,219,217

- 生成色块图的脚本
1 | import matplotlib.pyplot as plt |

